반응형
목표 :
- Host System의 기본 metric 수집을 위해 Node Exporter를 설치하고 Grafana에 Dashboard를 추가해보자.
참고 :
- Node Exporter는 모니터링을 하고자하는 System 들에 설치를 하면 되고, Prometheus는 별도의 모니터링 전용 서버에 설치를 하면 된다. (물론 단일 System의 모니터링을 위해서는 같은 System에 설치해도 된다.)
- Prometheus는
- 데이터 수집 방식이 Pulling 방식이기 때문에 Logstash나 Telegraf처럼 Pushing 방식보다 모니터링 서버 장애가 미치는 영향도가 적은 편이다.
- 간단한 key-value 형태의 메트릭을 기반으로 집계 및 저장 기능을 갖추고 있다.
- Pulling 방식을 사용하고 있기 때문에 모니터링 대상에서 metric 수집을 위한 API를 제공하는 Application이 설치가 되어 있어야 한다. host system의 모니터링을 위해 대표적으로 Node-Exporter를 활용하고, kubernetes나 docker container 모니터링을 위해 cAdvisor를 활용한다.
모니터링 대상 서버에 Node-Exporter 설치
docker-compose.yml 파일을 아래와 같이 작성하고 docker-compose up -d 명령어를 통해 실행한다.
docker-compose.yml
version: '3.8'
services:
  node-exporter:
    image: prom/node-exporter:latest
    container_name: node-exporter
    restart: unless-stopped
    volumes:
      - /proc:/host/proc:ro
      - /sys:/host/sys:ro
      - /:/rootfs:ro
    command:
      - '--path.procfs=/host/proc'
      - '--path.rootfs=/rootfs'
      - '--path.sysfs=/host/sys'
      - '--collector.filesystem.mount-points-exclude=^/(sys|proc|dev|host|etc)($$|/)'
    ports:
      - 9100:9100
모니터링 전용 서버에 Prometheus 설치
docker-compose.yml 파일을 아래와 같이 작성하고, conf 폴더 하위에 prometheus.yml 파일을 작성한 후 docker-compose up -d 명령어를 통해 실행한다.
docker-compose.yml
version: '3.1'
services:
   prometheus:
    image: prom/prometheus:v2.24.0
    volumes:
      - ./conf/:/etc/prometheus/
      - prometheus_data:/prometheus
    command:
      - '--config.file=/etc/prometheus/prometheus.yml'
      - '--storage.tsdb.path=/prometheus'
      - '--web.console.libraries=/usr/share/prometheus/console_libraries'
      - '--web.console.templates=/usr/share/prometheus/consoles'
    ports:
      - 9090:9090
    restart: always

volumes:
  prometheus_data:
conf/prometheus.yml
global:
  scrape_interval:     5s
  evaluation_interval: 5s

scrape_configs:
  - job_name: node
    metrics_path: /metrics
    static_configs:
      - targets:
        - 10.120.201.2:9100
Grafana에 모니터링 대시보드 구성하기
docker-compose.yml 파일을 아래와 같이 작성하고 docker-compose up -d 명령어를 통해 실행한다.
docker-compose.yml
version: '3'
services:
  grafana:
    image: grafana/grafana
    ports:
      - '3000:3000'
    volumes:
      - grafana:/var/lib/grafana
volumes:
  grafana:
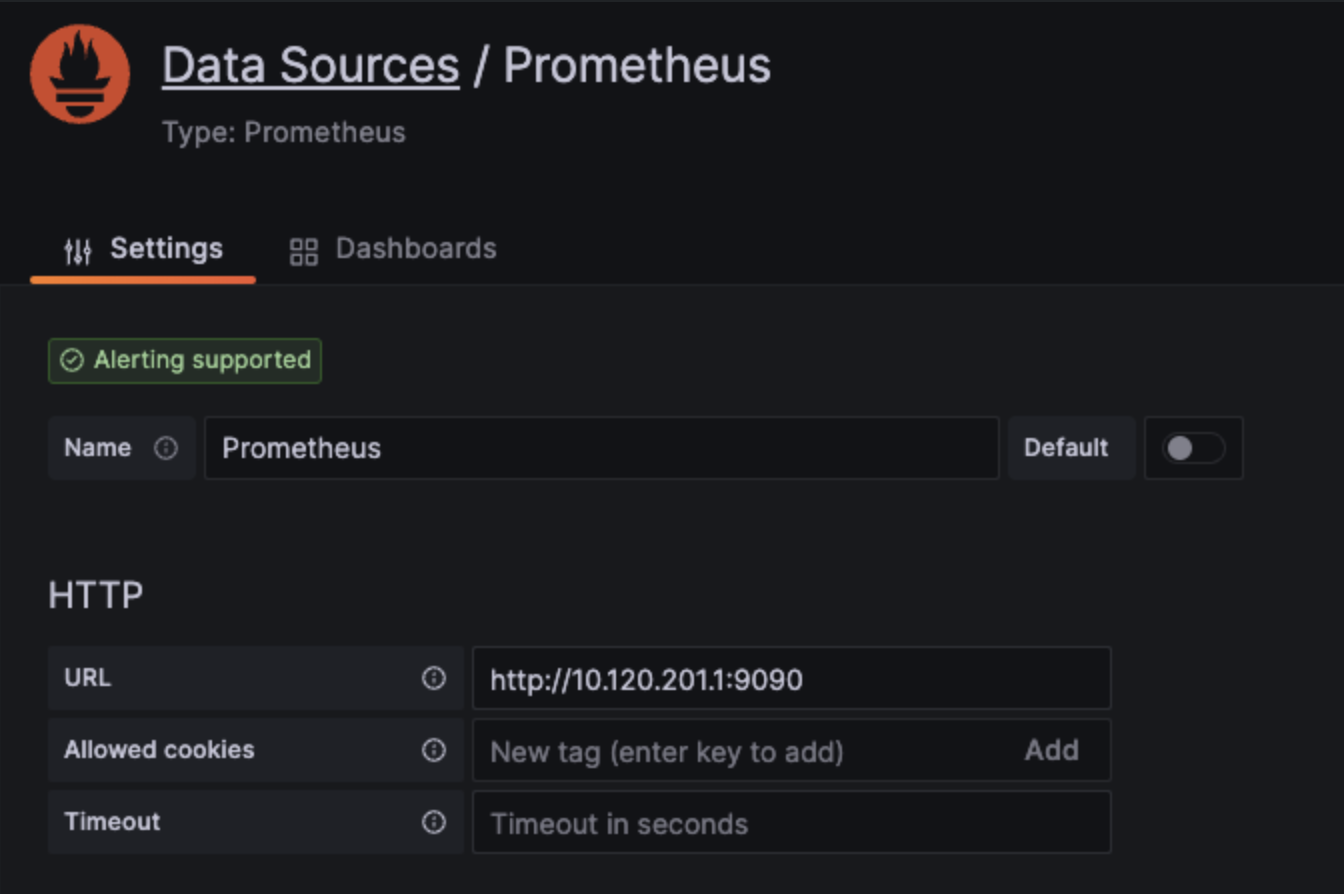
Data Source에 Prometheus 접속 URL을 추가한다.

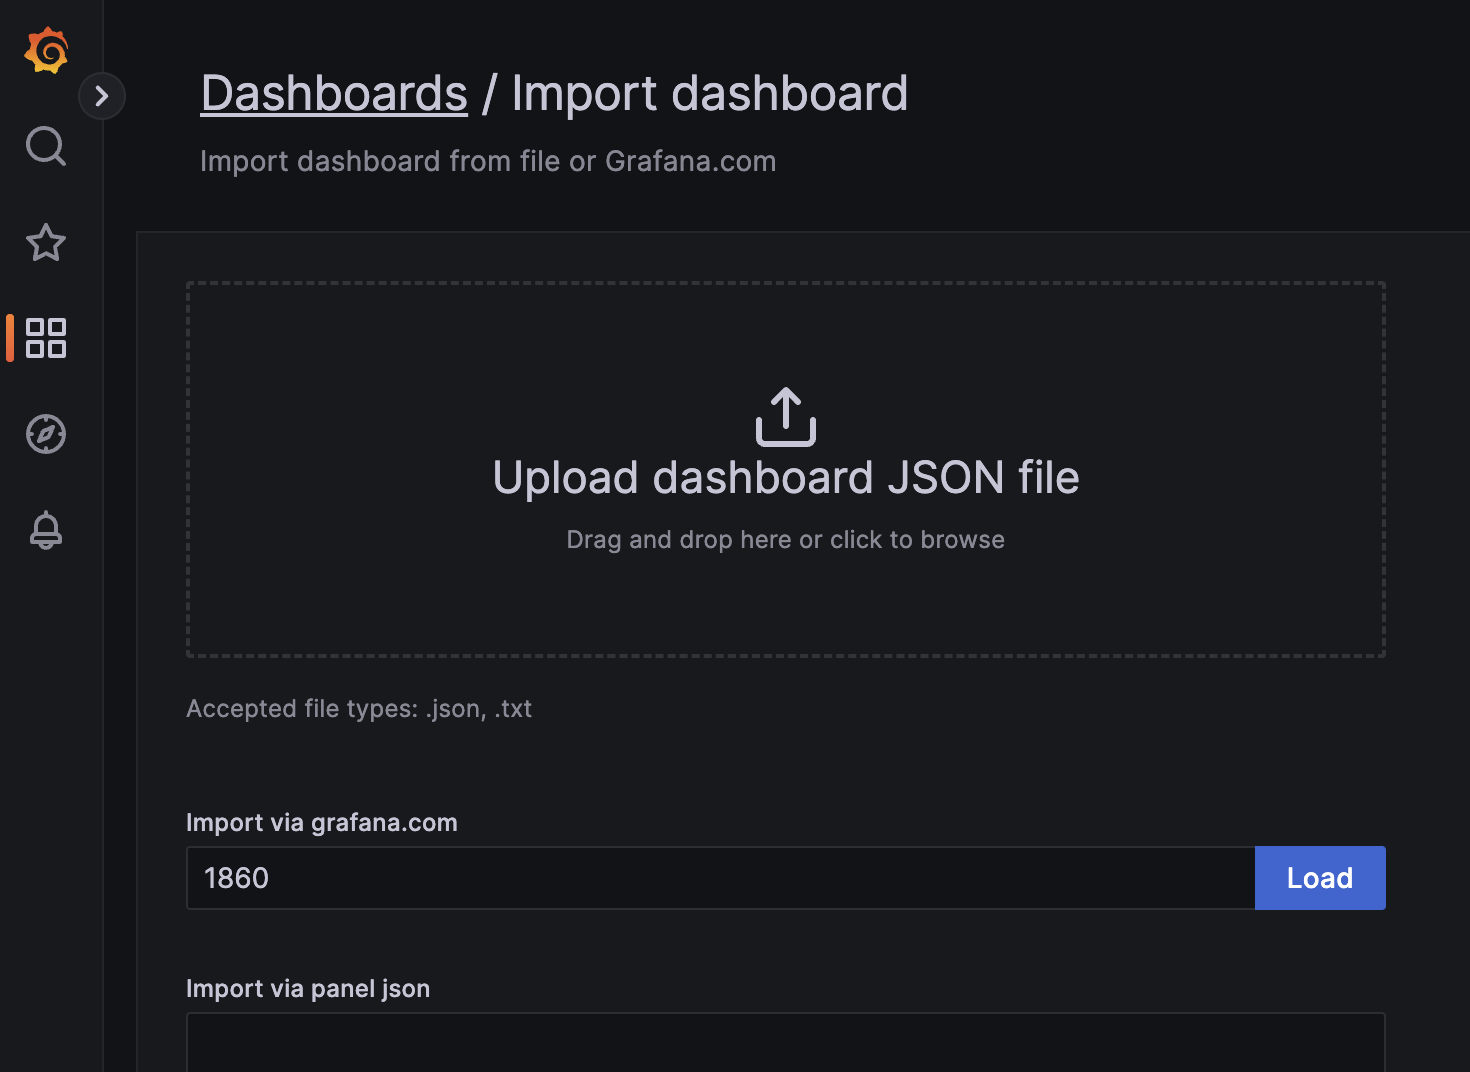
Dashboard > +Import 메뉴 선택하여 Import via grafana.com 부분에 ID 1860 을 입력하고 Load 버튼을 선택한다.

추가된 Dashboard 에서 Node Exporter로부터 수집되는 metric 들로 모니터링 가능한 항목들을 확인할 수 있다.

반응형
'Engineering > Tools' 카테고리의 다른 글
| prometheus에서 docker container metric 수집 방법 (cadvisor / daemon.json 설정) (0) | 2023.05.02 |
|---|---|
| [spreadsheet] UNIQUE Function (+ 공백 제거 FILTER Function) (0) | 2023.04.17 |
| [Grafana] Jmeter 실행 중 Grafana로 결과 모니터링 (미완료) (0) | 2023.03.13 |
| [spreadsheet] 그룹화(group rows) 전체 접기/펴기 (2) | 2023.03.06 |
| [confluence][macro] 확대(expand) (0) | 2023.01.29 |


댓글